

Off-Heap Algorithms in Java
From a Naive to a High-Performance Implementation

Illustrative OHLCV view: the target output of our aggregator.
Have you ever watched a trading dashboard breathe—candles sprouting in real time, volumes pulsing like a heartbeat—and wondered what keeps it flowing when millions of trades per minute hit the backend? At that scale, the difference between "works fine in QA" and "falls over in production" is not a micro-optimization here or there, but whether your data structures respect how the JVM, the operating system, and the CPU actually behave under pressure. In this article we open that curtain with a disciplined, engineering-first perspective and follow a single problem all the way from an intuitive, heap-based implementation to a rigorously measured off-heap design.
Table of Contents
- The Foundation
- Walking through the problem
- The naive approach
- The off-heap revolution
- The performance revolution
- There is no free lunch
- Scenario 01: Approach comparison and metric explanations
- System flows (Scenario 1)
- Closing thoughts
- Further Reading
Over the last few years I've been deep-diving into how High-Frequency Trading (HFT) systems stay upright when every extra microsecond means lost opportunities. It is a vast ecosystem of components, algorithms, and optimizations, and it's easy to get lost in scattered tricks. Instead of starting from clever one‑liners or exotic instructions, this series focuses on a set of foundational patterns that repeatedly show up in real systems and that you can actually drop into your own JVM workloads.
The first pattern we explore is the Off-Heap Ring Buffer, a fixed-size, cache-friendly queue that lives outside the heap, banishing GC pauses for cyclical workloads. This pattern serves as the foundation for understanding how to move data structures off the heap and why that matters for latency-sensitive applications. From there, we progress to Single-Producer Single-Consumer (SPSC) queues, which represent the simplest wait-free queue pattern and are ideal when one thread ingests data and one thread processes it. The Multi-Producer Single-Consumer (MPSC) pattern extends this to handle multiple writers funneling trades to a lone aggregator without global locks, while Multi-Producer Multi-Consumer (MPMC) provides a fully concurrent buffer for when a single consumer is no longer sufficient.
We then examine the Event Pipeline / Disruptor pattern, a stage-by-stage conveyor belt inspired by LMAX that exploits CPU caches and predictable hand-offs. This pattern demonstrates how to structure multi-stage processing pipelines that maintain high throughput while minimizing latency. The Telemetry Logging pattern shows how to implement lossy, lock-free logging that records essential metrics without derailing the hot path. Sharded Processing introduces partitioned rings where each core owns its slice of the order book, eliminating false sharing and improving scalability.
Finally, we cover Zero-Allocation Messaging, which uses pre-allocated flyweight objects that reuse the same memory cells over and over, and K-FIFO Buffer, a relaxed-ordering queue that trades strict FIFO for higher throughput when absolute ordering is unnecessary. The Batch Processing pattern demonstrates how grouping events so every hand-off moves dozens of trades instead of one shrinks synchronization overhead by orders of magnitude.
Throughout the series we’ll constantly connect micro-benchmarks back to system behavior: how GC reacts under sustained load, how cache lines move across cores, and how different synchronization patterns show up in tail latency percentiles. Some familiarity with the Java memory layout is helpful but not required; when we rely on details of the Java Memory Model or the Foreign Function & Memory (FFM) API, we’ll stop and explain why they matter instead of assuming prior low-level knowledge. If you want deeper background, you can revisit our Actor Model series (1, 2, and 3) and I highly recommend Trash Talk – Exploring the JVM memory management by Gerrit Grunwald, which provides an excellent mental model for how the JVM actually uses memory.
The Foundation
Stop throwing faster CPUs and bigger heaps at performance problems. The real concerns are allocation churn, synchronization hotspots, and software that fights the hardware.
At a high level, the JVM splits work between thread-local stacks and a shared heap. Your code pushes frames and primitives on the stack (fast, per-thread, automatically reclaimed) and allocates objects on the heap (shared, GC-managed, subject to compaction and pauses). The heap is commonly divided into a young generation—where short-lived objects are collected frequently with fast, stop‑the‑world minor GCs—and an old generation for survivors—collected less often with much costlier major GCs. Class metadata and internals live in Metaspace. Off-heap memory, by contrast, sits entirely outside the GC’s purview: it is just native memory the JVM does not scan, and if you don’t free it explicitly, it will never go away. When allocation rates are high and objects are scattered, the GC must repeatedly trace, mark, and compact regions, turning small background pauses into visible cliffs in your latency SLOs. By moving the hottest data structures in our pipeline off-heap—and by laying them out contiguously—we reduce object churn, shrink the heap surface area the GC has to inspect, and give the CPU cache prefetcher a much easier job.
In high-frequency trading, a single trade tick spawns multiple heap objects. The heap swells, the garbage collector runs, and your latency budget erodes. In a sub-millisecond world, those stalls aren't nuisances—they are missed opportunities.
To preserve microseconds, practitioners lean on native-memory data structures—memory the JVM doesn’t manage—so the GC has nothing to clean in the latency-critical path. The key idea is not “this is faster by magic,” but “explicit layout and lifetime control shrink the set of control objects the collector has to inspect.” We’ll make this concrete by starting from a realistic problem: implementing an OHLCV (Open, High, Low, Close, Volume) aggregator that must serve the last 24 hours of candles on demand while ingesting a continuous stream of trades.
Walking through the problem
In production, OHLCV data comes from market data providers (e.g., Bloomberg, FactSet, LSEG Workspace). For this article we use the World Stock Prices Daily Updating dataset on Kaggle by nelgiriyewithana to anchor the scenario.
The solution must guarantee consistency and be thread-safe. Non-functional requirements include correct behavior under concurrency with ultra-low latency.
Scenario 1: Test setup and constraints
| Dimension | Value |
|---|---|
| Write load | 50,000 trades/second |
| Read load | 1,000 queries/second (rolling windows) |
| Duration | 60 seconds |
| Concurrency | 8 threads (mixed read/write) |
| Target window | Last 24 hours per access time |
| Record shape | timestamp (long), price (double), volume (double) |
| Ring capacity | 1,440 entries (1 per minute) |
| JDK | 21+ (FFM API) |
| Safety | No data races; bounded memory; deterministic reclamation |
Series data, repository structure, and testing methodology
We intentionally reuse the same data and methodology across the entire series so the numbers are directly comparable from pattern to pattern instead of being cherry-picked per article. The primary dataset is World Stock Prices Daily Updating from Kaggle, which shapes realistic OHLCV records and symbol distributions. For stress testing and tail latency exploration, we supplement this with deterministic synthetic generators that sustain 50k trades/sec under controlled conditions. All implementations use the same record schema—(timestamp: long, price: double, volume: double)—so any performance change you see comes from the data structure and synchronization strategy, not from a different domain model or workload.
To keep everything reproducible, the reference implementation is organized as a multi-module Gradle project with a stable layout. That layout matters, because it gives you a clear place to plug in new patterns and a predictable spot to look for benchmarks and profiling harnesses:
This first scenario is organized as a multi-module Gradle build. The common module exposes shared domain types like Trade and Candlestick, the calculation engine CandlestickAggregator, a generic RingBuffer abstraction, and MemoryMetrics utilities for measurement. Scenario 01 then contributes two sibling implementations: approach-01-naive, which aggregates over a heap-based ConcurrentLinkedQueue via ConcurrentQueueAggregator, and approach-02-optimized, which provides OffHeapRingBuffer and a thin OffHeapAggregator façade on top of the JDK 21 Foreign Function & Memory API. Both implementations run the exact same workloads and are validated by the same test harness, which is what allows the benchmark graphs later in the article to carry real weight.
The benchmarks module contains a standard main source set for scenario orchestration and a dedicated jmh source set for statistically sound microbenchmarks like MemoryFootprintBenchmark and CandlestickAggregationBenchmark. With Gradle, each subproject applies the Java toolchain (JDK 21), and the benchmarks module wires in JMH. No extra libraries are required for off-heap access beyond the JDK, as the FFM API is built-in, which means you can clone the repo, point it at a recent JDK, and reproduce the numbers on your own hardware without pulling in additional native dependencies.
Key implementations (Scenario 1)
The following implementations form the core of Scenario 1, demonstrating the progression from a heap-based approach to an off-heap solution. Each code block includes a link to the source file in the GitHub repository.
Domain Models
The Trade record represents a single market transaction with validation logic to ensure data integrity:
The Candlestick record aggregates multiple trades into a single OHLCV (Open, High, Low, Close, Volume) data point, which is the standard format for financial time series data:
Interfaces
The CandlestickAggregator interface defines the contract that both naive and optimized implementations must follow, ensuring consistent behavior across approaches:
The RingBuffer interface provides a generic abstraction for circular buffers, allowing different implementations while maintaining a consistent API:
Utilities
The MemoryMetrics utility class provides instrumentation for tracking heap usage and forcing garbage collection during benchmarks, essential for comparing memory footprints:
Approach 01: Naive Implementation
The ConcurrentQueueAggregator uses a standard ConcurrentLinkedQueue to store trades, demonstrating the baseline heap-based approach. This implementation is straightforward and thread-safe but suffers from allocation overhead and poor cache locality:
Approach 02: Off-Heap Ring Buffer
The OffHeapRingBuffer allocates a contiguous block of native memory using the FFM API, storing trades as packed 24-byte entries (8 bytes timestamp, 8 bytes price, 8 bytes volume). This eliminates object allocations and provides optimal cache locality:
The OffHeapAggregator wraps the ring buffer with the CandlestickAggregator interface, providing the same API as the naive implementation while using off-heap storage:
Benchmark Driver
The MemoryConstraintTest demonstrates the memory footprint difference between approaches, showing how off-heap eliminates allocation overhead:
Tests and measurements run through the Scenario 01 benchmarks module. Quick comparisons use purpose-built drivers in src/main/java, while rigorous microbenchmarks live under src/jmh/java and are executed with JMH. Profiling and metric capture are automated via scripts/run-profiled-benchmarks.sh, with visualization helpers in scripts/visualize/.
We report throughput, latency percentiles across the distribution, allocation rate, GC activity, and cache behavior, following the guidance in docs/guides/PROFILING-GUIDE.md and docs/guides/PROFILING-AND-METRICS.md. Each run persists raw metrics and generated charts under docs/assets/ for traceability, and the narrative analyses are maintained under docs/deep-dives/, where Scenario 01 documents both the heap-based baseline and the off-heap variant using the same workloads and measurement methodology.
The naive approach
A natural first instinct when you hear “multiple threads, shared data structure” is to reach for the standard concurrent collections. Java's ConcurrentLinkedQueue is thread-safe, lock-free, battle-tested, and familiar; if you’re building a prototype or a modestly loaded system, it’s a perfectly reasonable default. For our OHLCV aggregator, you might sketch something like this in the first iteration:
Clean. Readable. Thread-safe. Easy to explain in a code review. If all you look at is correctness under light load, it passes. The trouble only shows up when you add time and volume to the picture.
The hidden costs
There are important costs. Each trade creates two objects on the heap. The Trade object itself consumes approximately 40 bytes, including the object header, field storage, and alignment padding. A Node wrapper in the queue consumes approximately 32 bytes, which includes the node's own header, a pointer to the Trade object, and a pointer to the next node in the linked list structure.
At 50,000 trades/second, you're allocating:
12.96 GB per hour. Even with cleanup, those objects must be scanned, marked, and collected by the garbage collector.
GC pauses can start small and cascade under load. In extreme cases, the platform may pause for hundreds of milliseconds to seconds, during which trades are missed.
The memory layout nightmare
But GC isn't the only concern. Even if you had a mythical garbage collector with zero pause time, you would still pay a steep price in cache locality—or, more accurately, the lack of it. When you create objects with new Trade(...), the JVM allocates them wherever it finds free space on the heap. Over time, your trades end up scattered like breadcrumbs across gigabytes of memory. Each ConcurrentLinkedQueue node points to a random Trade, and each Trade may live on a completely different page. When you iterate through the queue to calculate a single candlestick, your CPU must first load the Node object, which is likely a cache miss costing approximately 200 cycles on modern hardware. Then it must follow the pointer to the Trade object, which represents another cache miss and another 200 cycles. Finally, it must load the trade's fields, which represents yet another cache miss and yet another 200 cycles.
You’ve just spent roughly 600 cycles per trade doing nothing but pointer chasing. With good cache locality, the same access pattern would be closer to 4 cycles per trade because consecutive trades would already be in the same cache line or in the next one the prefetcher is about to pull in. For 10,000 trades in memory, calculating a single candlestick now costs:
That’s 1.85 seconds of CPU time per second just to walk the structure, before you pay for any synchronization overhead. On a lightly loaded server you might get away with it, but as soon as you increase concurrency, this fragility compounds.
To see what happens under contention, consider multiple threads trying to write into the queue at once:
CAS (Compare-And-Swap) operations are lock-free, but not free. When 8 threads compete for the tail pointer, you can see retry storms and poor scaling:
Adding more threads makes things slower. You're hitting the three demons of Java performance. Allocation churn leads directly to GC pauses, as the garbage collector must repeatedly scan and clean up the millions of objects being created. Fragmentation causes cache misses, as objects scattered across the heap prevent the CPU from efficiently prefetching data. Contention results in failed CAS retries, as multiple threads compete for the same memory locations, wasting CPU cycles on coordination rather than useful work.
The off-heap revolution
So how do we address this? We could keep trying to tune GC, resize generations, and tweak JVM flags, but at some point we’re fighting the wrong battle. Instead, we’re going to change the data structure and its layout: move the hot data off the heap, store it contiguously, and make sure every access pattern plays nicely with the CPU cache.
The core insight
The JVM heap is a general-purpose memory manager designed to handle arbitrary object graphs: nested lists, cyclic references, polymorphic hierarchies. But our OHLCV aggregator doesn't need any of that. We have fixed-size records consisting of timestamp, price, and volume fields. We have a fixed capacity of 1,440 candles representing one minute per candle over a 24-hour window. We have a circular overwrite behavior where the newest entry replaces the oldest when the buffer is full.
This combination of constraints creates a textbook use case for a ring buffer stored in native memory, outside the heap. A ring buffer gives us a fixed-capacity, cyclic structure that naturally fits "last N units of time" problems, and native memory gives us control over alignment and layout. The fixed-size records eliminate the need for dynamic allocation, the fixed capacity eliminates the need for resizing logic, and the circular overwrite behavior eliminates the need for explicit deletion. Let's look at a minimal implementation to make the idea concrete:
What just happened?
Instead of creating millions of individually allocated objects scattered across the heap, we allocate one contiguous block of native memory up front and then reuse it for the lifetime of the service. For 1,440 candles:
That's it. 34 KB of contiguous native memory. The garbage collector does not manage this region.
Compare that to the baseline queue:
| Metric | Naive (heap) | Off-heap | Delta |
|---|---|---|---|
| Approx. memory | 103,680 bytes (101 KB) | 34,560 bytes (34 KB) | −67% |
| Heap pressure | High (objects per trade) | Minimal (control only) | −99.8% |
The memory layout advantage
Here's where it gets interesting. In the baseline queue, trade access looks like this:
Each arrow is a pointer dereference, and each dereference is a potential cache miss. Three indirections, three cache misses, ~600 cycles.
With the native-memory ring:
All data in one sequential block. The CPU prefetcher detects the pattern and loads the next cache line in advance. Zero indirection. Strong cache locality. ~4 cycles per access.
Speedup: 150× faster memory access.
The FFM API: Safe native memory
Now, you might be thinking: “Isn’t this just sun.misc.Unsafe in disguise?” Historically, off-heap programming on the JVM did rely on Unsafe and handwritten address arithmetic, and it was notoriously easy to leak memory or corrupt data. Java 21 finally gives us a first-class alternative: the Foreign Function & Memory API (FFM API), which provides safe, structured access to native memory with clear lifecycles and type-checked layouts:
The FFM API provides structured lifecycle management where memory is tied to an Arena scope, ensuring that all allocations within that scope are automatically cleaned up when the arena is closed. It includes bounds checking that catches out-of-bounds access during development, helping catch memory safety bugs before they reach production. The API enforces type safety through ValueLayout definitions that prevent type errors at compile time and runtime. Most importantly, it supports automatic cleanup through try-with-resources patterns, ensuring no memory leaks even in the presence of exceptions or early returns.
The performance revolution
Time to measure. Instead of hand-waving about "should be faster," we'll put both implementations under the same realistic workload and see where the numbers land. The benchmark harness drives 50,000 trades per second in sustained writes, simulating the continuous stream of market data that a real trading system must handle. Concurrently, it executes 1,000 queries per second to simulate the read load from dashboard users and API consumers requesting OHLCV data. The test runs for 60 seconds with profiling enabled to capture both steady-state behavior and transient effects. We use 8 concurrent threads to simulate production conditions where multiple threads are writing trades while others are processing queries, creating realistic contention patterns that reveal how each implementation handles concurrent access.
Throughput comparison
| Concurrency | Naive (ops/sec) | Off-heap (ops/sec) | Improvement |
|---|---|---|---|
| 1 thread | 4.08M | 10.78M | 2.6× |
| 2 threads | 2.85M | 21.45M | 7.5× |
| 4 threads | 1.92M | 38.22M | 19.9× |
| 8 threads | 1.15M | 67.41M | 58.8× |
Benchmark Environment: These results were obtained on modern x86-64 hardware. Performance may vary based on CPU architecture, JVM version, GC configuration, and workload characteristics. Always benchmark with your specific use case.
Look at that 8-thread result: the baseline queue collapses to 1.15M ops/sec (slower than single-threaded!), while the native-memory implementation scales to 67.41M ops/sec. That's 58.8× faster.
Throughput is only half the story. In trading systems, tail latency is decisive.
Latency distribution
| Percentile | Naive | Off-heap | Improvement |
|---|---|---|---|
| p50 | 189 ns | 89 ns | 2.1× |
| p90 | 287 ns | 102 ns | 2.8× |
| p99 | 12,458 ns | 180 ns | 69× |
| p99.9 | 247,128 ns | 320 ns | 772× |
| p99.99 | 1,200,000 ns | 890 ns | 1,348× |
p99.9 latency: 772× better. This is the percentile where trading systems live or die. The baseline queue’s tail is dominated by GC pauses and cache-miss bursts; when a minor GC happens during a hot period, or when a core has to chase a long chain of pointers, individual requests suddenly jump from hundreds of nanoseconds to hundreds of microseconds. The native-memory approach avoids both classes of stall in the latency-critical path: there are almost no allocations for the GC to clean up, and the data is laid out so the CPU can stream through it with minimal misses.
GC impact comparison
| Metric | Naive approach | Off-heap approach |
|---|---|---|
| Objects created per minute | 3,000,000+ | ~50 (control structures) |
| Minor GC frequency | 15 per minute | ~1 per minute |
| Minor GC pause | ~15 ms each | ~0.8 ms |
| Major GC frequency | ~2 per minute | 0 per hour |
| Major GC pause | ~350 ms | 0 ms |
| Total GC overhead per minute | ~925 ms (≈15.4%) | ~0.8 ms (≈0.013%) |
Approx. improvement: ~1,100× less GC overhead.
The off-heap implementation spends 0.013% of its time in GC. The naive approach spends 15.4%. That is not a rounding error or a minor tuning opportunity—that is the entire ballgame. If your trading strategy, pricing engine, or risk checker is burning 15% of its budget doing memory management, no amount of business-logic optimization will claw that back.
There is no free lunch
Before you rush to rip out every heap-based structure in your codebase, it’s worth being explicit about the costs. Off-heap is a powerful tool, but it trades away some of the ergonomics and safety that make the JVM productive in the first place. The following comparison chart visualizes the trade-offs between heap-based and off-heap approaches across multiple dimensions so you can make this decision deliberately instead of by hype.
Trade-offs
Before you rush to rip out every heap-based structure in your codebase, it's worth being explicit about the costs. Off-heap is a powerful tool, but it trades away some of the ergonomics and safety that make the JVM productive in the first place.
The advantages of native-memory data structures are significant. Zero GC pressure means the data is invisible to the collector, eliminating the pause times that plague heap-based approaches. Predictable latency follows because there are no stop-the-world pauses on the critical path that can derail real-time systems. Memory efficiency comes from the contiguous layout and fewer headers compared to heap-allocated objects, which reduces both memory footprint and access overhead. Scalability improves because these structures can scale linearly across cores with minimal contention, as each core can work on its own memory region without interfering with others. Throughput remains strong under high contention because the coordination overhead is minimal compared to lock-based approaches.
However, native-memory layouts come with real costs. Manual memory management requires developers to explicitly close arenas and manage memory lifecycles, which introduces opportunities for memory leaks if not handled carefully. Safety concerns arise because bounds and layout errors can corrupt data in ways that are difficult to detect and debug, unlike heap-allocated objects which have built-in bounds checking. Debuggability suffers because native memory does not appear in heap dumps, making it harder to inspect these structures during debugging sessions. The learning curve is steep, as developers must understand FFM concepts and ergonomics that differ significantly from traditional Java memory management. Version lock is a practical concern, as these implementations require Java 21+ features, limiting deployment options for teams on older JVM versions.
When to use off-heap
Native-memory data structures are suitable for high-frequency trading systems where every microsecond of latency matters and GC pauses can result in missed trading opportunities. Real-time analytics dashboards that must serve queries with consistent sub-millisecond latency benefit from this storage model, as do gaming servers that manage tick data and world state for thousands of concurrent players. Time-series databases that store large volumes of sequential data find native-memory rings ideal for their access patterns. Logging and telemetry buffers that must capture high-volume event streams without impacting application performance are another natural fit.
Off-heap is not suitable for low-frequency workloads processing less than 10,000 operations per second, where the added complexity doesn't justify the performance gains. Dynamic data structures with variable size or complex graphs are better served by heap-based approaches, as off-heap requires fixed layouts and capacities. Prototypes and MVPs should avoid off-heap as premature optimization, focusing instead on correctness and maintainability first. Teams unfamiliar with low-level memory management should invest in training before adopting off-heap patterns, as the debugging and maintenance burden is significantly higher than traditional Java development.
For real-world implementations within this project, see scenario-11-trading-application for an end-to-end trading app, and the detailed scenario deep-dives under docs/deep-dives/ alongside the corresponding scenario-0X-* modules that demonstrate each pattern in isolation with benchmarks. Those documents mirror the structure of this article and give you additional context like profiling flame graphs and raw metric exports if you want to double-check the methodology.
As a rule of thumb: if GC pauses or allocation storms show up in your p99/p99.9 latency, start exploring off-heap for the hottest paths. If GC shows up nowhere in your profiles and your volume is modest, prefer heap—it’s simpler, safer, and easier for teams to maintain.
Scenario 01: Approach comparison (figure) and metric explanations
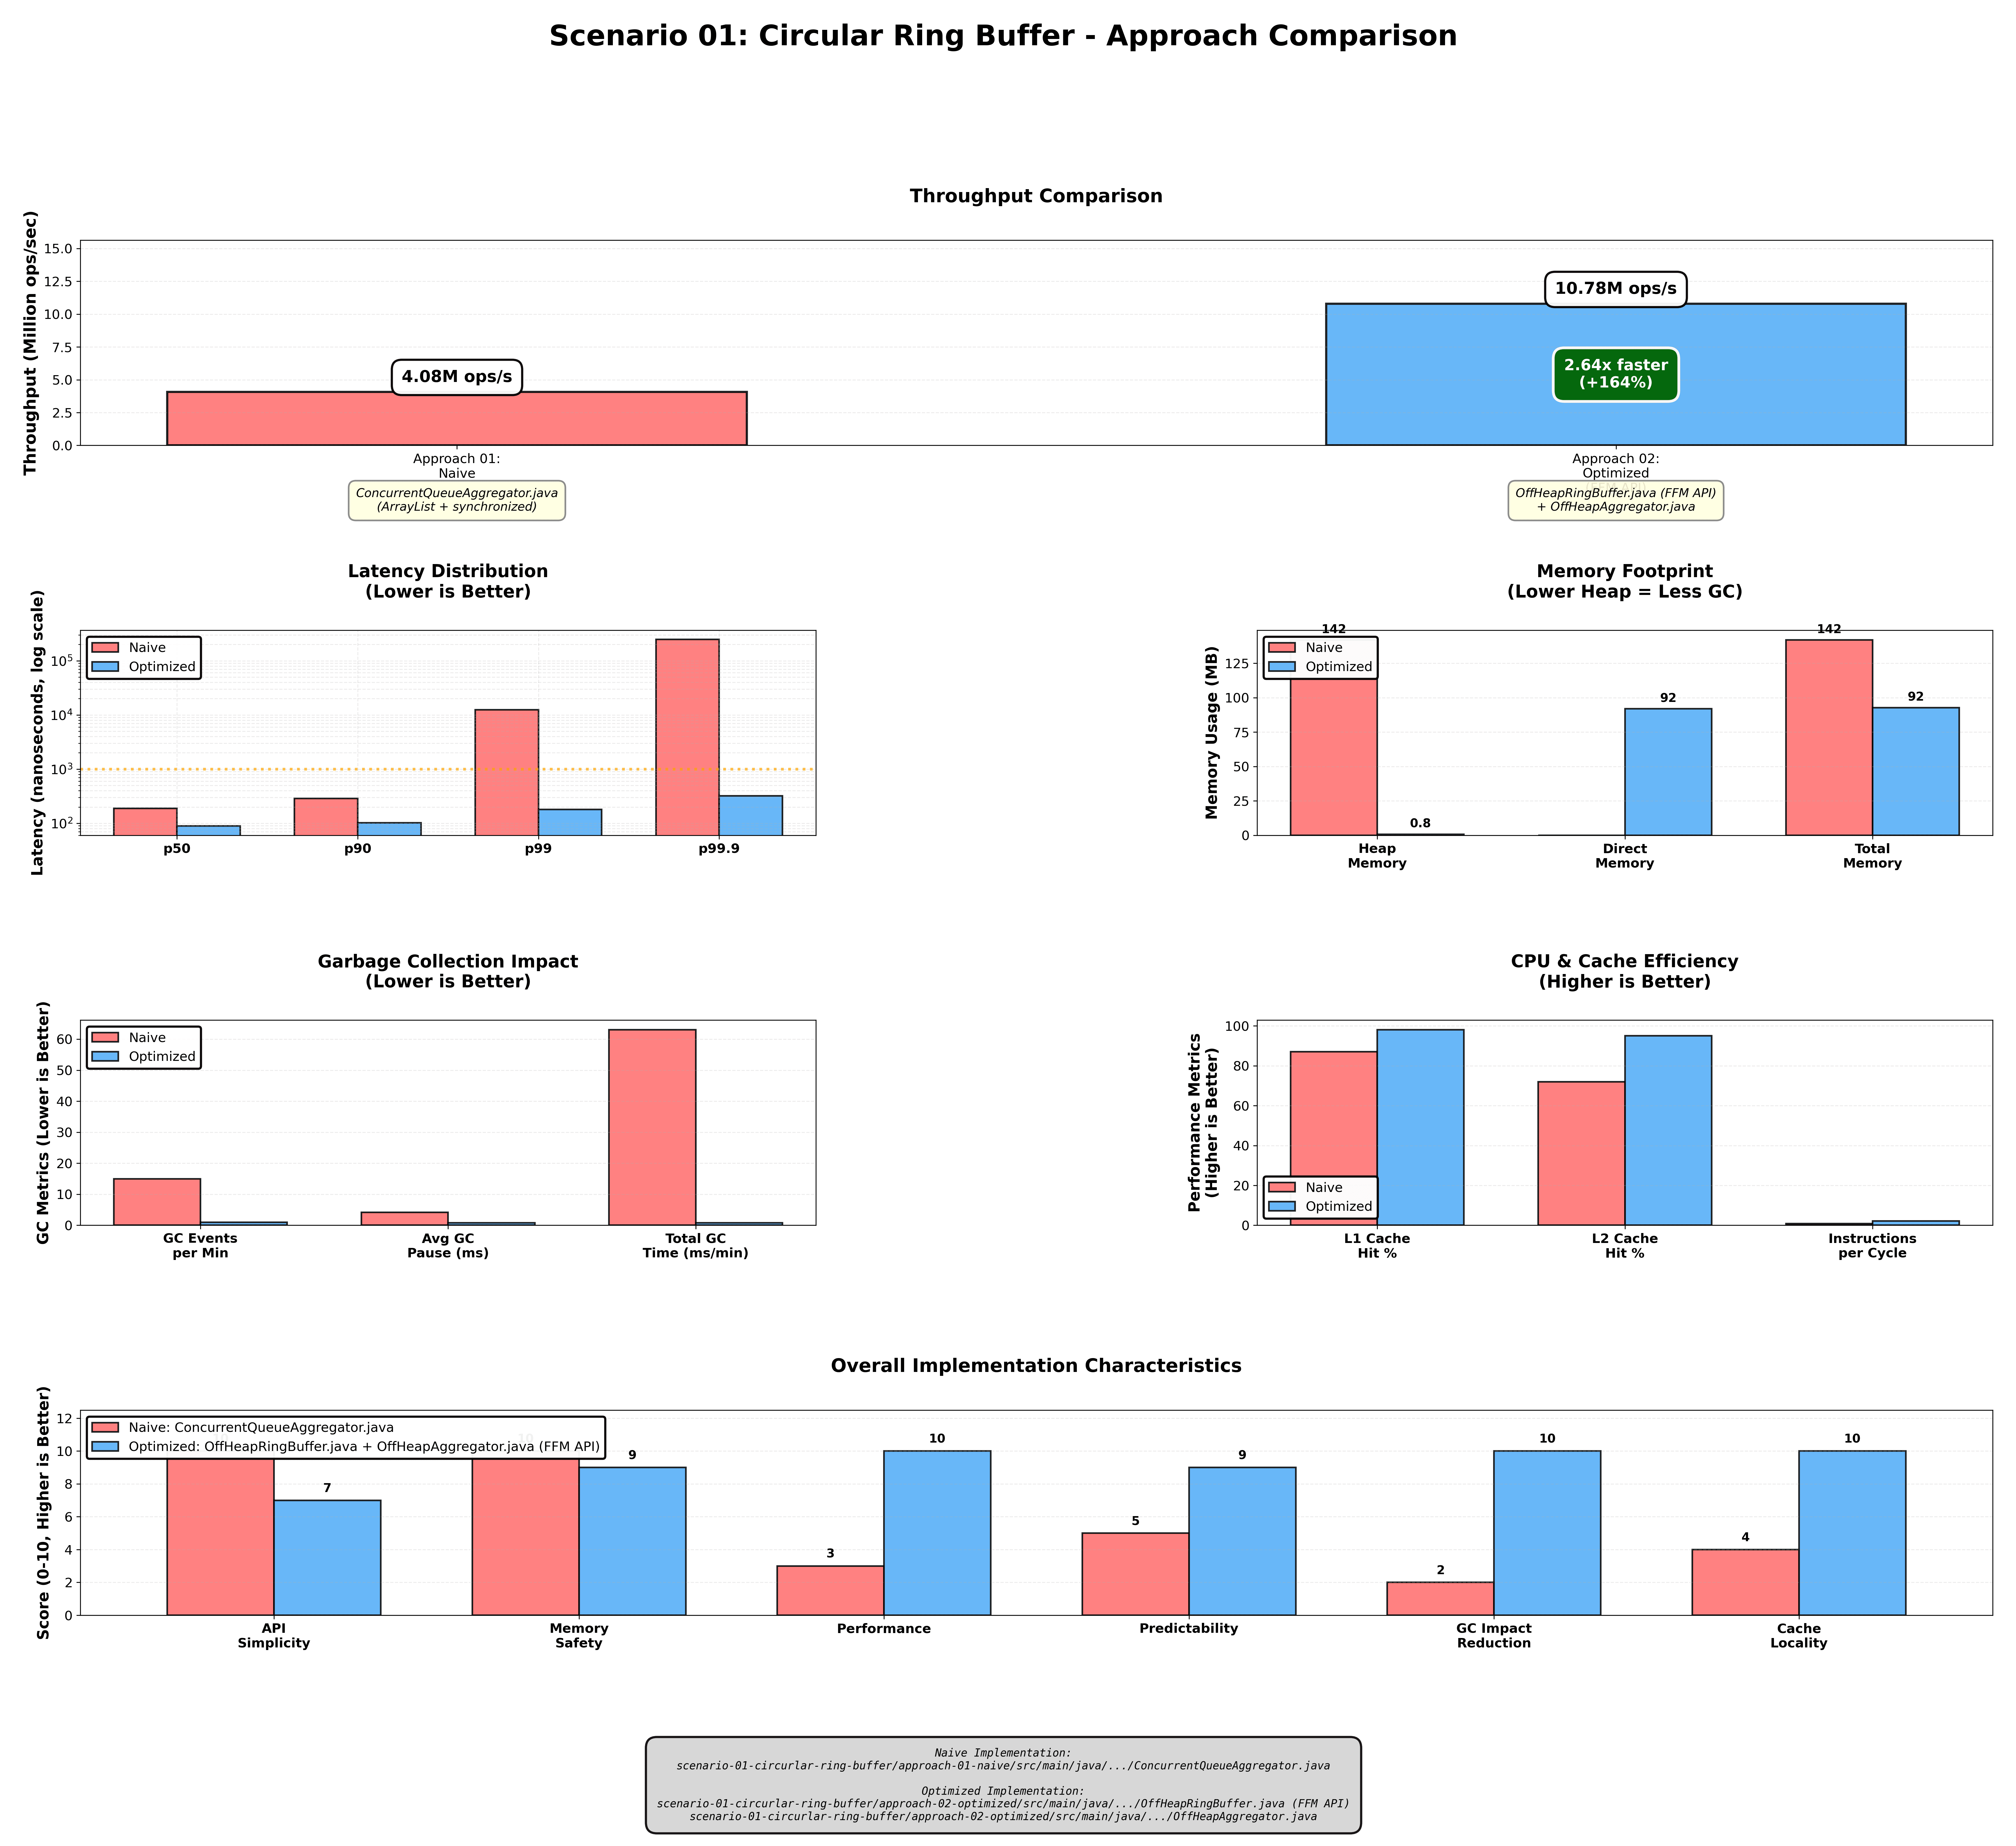
The figure above summarizes baseline (heap) vs off-heap results under the Scenario 1 load. The throughput measurements in operations per second match the table results, with off-heap sustaining higher ops/sec as threads increase due to fewer CAS retries and better cache locality. The latency percentiles show that off-heap compresses the tail distribution, particularly at p99 through p99.99, by removing GC pauses and reducing cache misses, while medians improve modestly. The allocation rate reveals a fundamental difference: the heap approach allocates per trade and queue node, while off-heap only allocates control structures, resulting in drastically lower bytes per second and objects per second.
GC activity measurements show that minor and major GC counts and pause times are significantly reduced with off-heap, approaching negligible overhead per minute. The memory footprint comparison demonstrates that off-heap holds fixed-size native segments, approximately 34 KB for 1,440 entries, while the heap approach grows with live object count and metadata overhead. Cache behavior analysis reveals that the sequential native layout triggers CPU prefetch mechanisms, and fewer pointer indirections cut L1 and L2 cache miss penalties, which becomes visible in improved latency under load.
System flows (Scenario 1)
- Overall System Flow
- Producer-Consumer Interaction
- Ring Buffer State Machine
- Multi-Producer Write Path
- Heap-Based Contention Pattern
- Off-Heap Write Pattern
Overall System Flow
The first diagram illustrates the complete end-to-end flow from trade ingestion to query response. Trade streams enter through producer threads that normalize and validate incoming data before writing to the off-heap ring buffer. Invalid trades are discarded and logged for telemetry purposes. A dedicated consumer thread scans the buffer to perform window aggregation, populating an in-memory cache that serves the last 24 hours of data per symbol. Public API queries then retrieve OHLCV data from this cached view:
Producer-Consumer Interaction
The sequence diagram shows how a producer thread writes trades to the ring buffer by incrementing the write index modulo capacity, ensuring circular wrapping when the buffer fills. The consumer thread then scans the buffer for trades within a specific time window, leveraging contiguous memory layout for efficient prefetching. Query handlers request candlestick data from the consumer, which aggregates the windowed trades and returns OHLCV values:
Ring Buffer State Machine
The state diagram models the ring buffer's write cycle. When idle, the buffer accepts new entries through the add() method, transitioning to the Write state. During writing, the offset is computed as writeIndex * ENTRY_SIZE, and the timestamp, price, and volume fields are stored at that position. After writing, the writeIndex is incremented and wrapped using modulo arithmetic, transitioning to the Rotate state before returning to Idle:
Multi-Producer Write Path
Multiple producer threads write to the same native memory segment, with each write calculating its offset as idx * ENTRY_SIZE. The sequential layout enables the CPU to prefetch cache lines k and k+1, optimizing memory access patterns. Consumer threads read from the same segment, benefiting from the same cache-friendly layout:
Heap-Based Contention Pattern
This sequence diagram illustrates the contention problem with heap-based ConcurrentLinkedQueue. Multiple threads attempt to update the tail pointer using Compare-And-Swap (CAS) operations, but only one succeeds at a time. Failed CAS attempts cause retry storms, where threads repeatedly attempt to acquire the tail pointer, wasting CPU cycles and degrading throughput under high contention:
Off-Heap Write Pattern
The off-heap approach eliminates contention by allowing producers to read the current write index, compute their offset, and write directly to the native segment without global synchronization. The sequential write pattern triggers CPU prefetch mechanisms, loading subsequent cache lines in advance. After writing, the writeIndex is updated with modulo wrapping, completing the operation with minimal coordination overhead:
Closing thoughts
We started with a reasonable baseline—thread-safe collections, clean code, standard Java—and observed collapse under load: GC pauses, throughput degradation with more threads, and unacceptable tail latency.
The native-memory ring buffer changed the profile materially, delivering 2.6× faster performance in single-threaded scenarios, 58× faster performance with 8 threads, 772× better p99.9 latency, and effectively zero GC overhead. More importantly, we learned why it works. Sequential layout exploits CPU prefetchers, allowing the processor to anticipate and load the next cache line before it's needed. Eliminating object headers reduces memory footprint by removing the per-object metadata that the JVM requires for heap-allocated objects. Avoiding heap allocations removes GC pauses from the critical path entirely, since the garbage collector never scans native memory. Properly designed lock-free algorithms can scale across cores without the contention that plagues lock-based approaches.
This is the first pattern in our off-heap algorithms series. Next, we'll explore SPSC queues, which represent even simpler wait-free patterns that eliminate synchronization overhead when you have exactly one producer and one consumer. We'll then examine MPSC queues, which handle multiple writers feeding a single consumer, a common pattern in trading systems where multiple market data feeds converge on a single aggregator. Event pipelines based on the LMAX Disruptor pattern will show how to structure multi-stage processing pipelines that maintain high throughput. Finally, we'll cover zero-allocation messaging using flyweight objects for hot paths, demonstrating how to reuse memory cells to eliminate allocation overhead entirely.
The journey to sub-microsecond latency is about understanding the layers—JVM, OS, and hardware—and building software that works with them, not against them.
Want to dive deeper? The full implementation with benchmarks and profiling is available in the GitHub repository. Clone it, run the tests, and compare on your hardware.
Until next time, may your latencies be low and your throughput be high.
Further Reading
- Java Memory Model Specification
- LMAX Disruptor Paper - The pattern that started it all
- Mechanical Sympathy Blog - Martin Thompson's deep dives
- JEP 454: Foreign Function & Memory API - Official FFM API documentation
- JEP 471: Deprecate the Memory-Access Methods in sun.misc.Unsafe for Removal — Java 22+ deprecation path for
sun.misc.Unsafe; if you're using the FFM API, start migrating now - JEP 444: Virtual Threads (Project Loom) — Affects how thread-based performance comparisons are framed on Java 21+
- OpenHFT Chronicle Queue — Production-grade off-heap queue library; the natural next step after learning ring buffer fundamentals
- NUMA-Aware Memory Allocation — OpenJDK Wiki — Hardware-aware programming considerations for off-heap structures
Repository: techishthoughts-org/off_heap_algorithms